The historic 2020 Presidential Election will be here soon! Even if students aren’t old enough to vote, it’s important for them to learn about the election (and build their math skills at the same time)! Below you’ll find several ways to incorporate math learning into studying an integral part of the United States’ democratic process.
STEM-ify Your Mock Election
Probability and Statistics: Collecting that Exit Poll Data!
Have your students devise an efficient system for collecting exit poll data during a mock election. Start by explaining that even though elections outcomes aren’t official until the polls close, exit polling is used to project outcomes as media organizations want to begin announcing winners as soon as possible. Additionally, exit poll data is used to analyze outcomes post-elections (e.g. why or how a certain demographic group voted overall).
Ask your students:
-
- Do you think it would be possible to collect data from every single voter? Why?
- What is a representative sample? How would you determine a representative sample? For example, if you know that 50% of voters in your mock election are in 4th grade, and 40% are in 5th, then what would your representative sample have to include? Upper grades: you can also discuss margin of error- what it means and why it is used.
- What is the most efficient method for collecting exit poll data? Will you use low-tech (e.g. paper survey or phone bank), or high-tech (e.g. touch-screen device such as an iPad)? Why? What are the potential benefits to each?
- What outcomes do you predict based on the data you collected? How will you choose to present this data?
- Compare: How did your exit poll predictions compare to actual election results? If different, where were the errors in your polling methodology? How can they be corrected?
- What are the benefits of polling? Potential issues? Here is a short article on Polling Pitfalls.
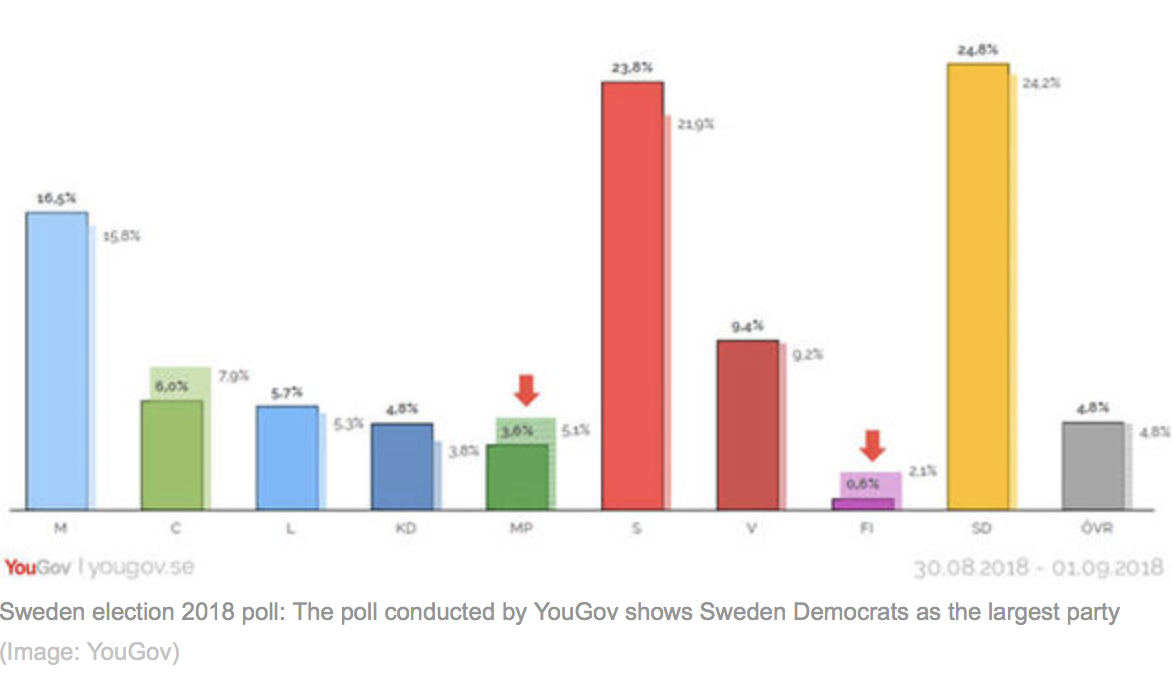
Graph it!
Post mock-election, have your students choose their own way to graph the results. For example, depending on the data collected, they may break down results by demographics such as gender, race or ethnicity, grade level, etc. They may choose a scatter plot, bar graph, line graph, Histogram or other method of representing the data. Have students share their graphs with the class and ask guiding questions such as
- How does the way information is presented on a graph change our interpretation of it?
- Why might you choose one type of graph to represent your data over another?
- What surprised you about this graph? Why? What types of unsolicited political ads do they see, if any?
Instagram Videos and Algorithms this Election Season
Algorithms are problem-solving operations used by social media channels such as Instagram or Snapchat to process user data collected by companies and apply it to what posts, advertisements or stories they see in their feed and how they are able to interact with them.
Explain that these algorithms impact what types of political ads or news stories students may see on their feeds. As a homework assignment, have them analyze their own social media feed channels (or a family member’s if they don’t have their own) and consider the following questions in a journal entry:
- What have they posted on their feed or what groups do they follow that their social media feed may have collected data about?
- Do the political ads or stories align to their personal beliefs? If so, what assumptions might they make about other people who support similar candidates or issues?
Here is a short article on Instagram’s feed.
Civics STEM Project Based Learning
This is a great time to demonstrate to your students that our lived world is an interdisciplinary one. Plan some fun activities with social studies teachers! Some great ideas are available here.
Early Childhood Videos
- Let’s Take a Vote
- You Choose
- Schoolhouse Rock video on What is the Electoral College
Articles on the Mathematics of Voting
- Did you vote?
- How to Rig an Election?
- Math and the Electoral College
- Elections Don’t Work At All. You can Blame the Math.
- Rig the Election with Math

 Dr. Koshi Dhingra has dedicated her career to STEM education and is passionate about having every child live up to their potential. Seeing a lack of girls and other underrepresented youth in STEM programs, she founded talkSTEM in 2015 to address the imbalance. She has a doctorate in science education from Teachers College, Columbia University, has years of experience teaching in graduate and undergraduate programs, and has held leadership roles in universities. She advises and collaborates with a broad range of educational institutions globally. Dr. Dhingra began her career teaching science in middle and high school in New York. She lives in Dallas, Texas with her husband, three children, and two dogs.
Add comment